Simulation & Verification are fundamental in the process of developing any good quality FPGA-based RTL codification. These are key steps within SoC-e’s designing procedures, and in this article, we are going to provide more insights about them in our Networking IP Core portfolio.
The whole process is divided in the following high-level steps:
- Entity/Block-oriented simulation: Simulation at entity/block-level for the different modules that compose each IP Core, by generating stimulus on each input signal and verifying that the RTL code behaviour is the expected one.
- Global-oriented simulation: Once the different modules have been validated individually, the next step implies simulating the whole IP as a single UUT (Unit Under Test).
- (On) Hardware testing: Even though an extended simulation plan provides a good level of trustiness, there are still many corner situations that can’t be verified on a virtual environment. For those cases, a hardware-based test plan is required, and also the last step towards a high-quality result.
In this article we will be covering the second step: how global-oriented simulation is performed in SoC-e’s IP Cores.
Global-oriented simulation
A global simulation implies verifying the correct behaviour of the whole IP entity, including every single sub-module that takes part of the product. In order to adapt to different customer’s use cases, SoC-e’s IP’s have been designed with flexibility in mind. This implies that any of our IP Cores are highly configurable, both at synthesis time (in order to optimize the footprint in the FPGA) as well as during runtime. Runtime configuration is possible thanks to a register map which is available with different interface options (in the example below, AXI4 is used).
This flexibility represents also a challenge for the simulation process, as it is required to configure the IPs according to the different tests cases in simulation environment. In response to this, SoC-e team has developed an amazing, smart testbench environment in which real-time configuration is possible and automated in a way developers can execute complex simulations in a click & play approach. For example, the testbench can send Ethernet Frames through the switch, and can read the results by accessing to the statistic registers of the IP Core (and check if the outputs are as expected).
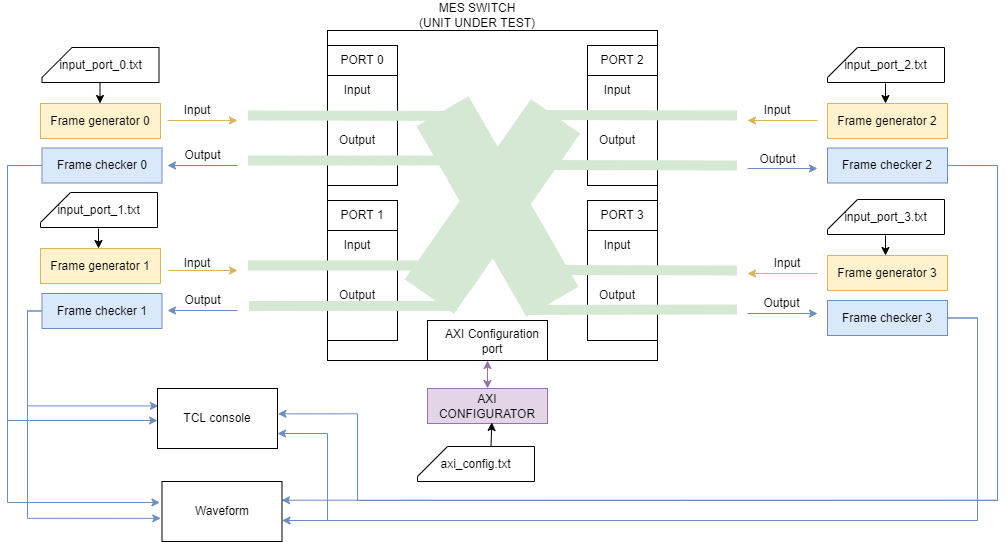
This greatly speeds up the debugging process and allows the team to perform quick iterations that would be much slower in a hardware-based test environment. In the picture below you can see a block diagram with the architecture of such global testbench (using our Managed Ethernet Switch IP Core):

The Managed Ethernet Switch (MES) is represented as the UUT. The rest of the testbench components are non-synthesizable VHDL modules that conform the whole environment:
- Frame Generator: this module is connected to the ingress ports of the Ethernet Switch IP and is responsible for generating stimulus (ethernet frames).
- Frame Checker: this module is connected to the egress ports of the Ethernet Switch IP and is responsible for analyzing the traffic forwarded by the switch.
- AXI Configurator: it controls the AXI4 configuration bus in order to modify the content (read/write operations) of the configuration registers.
Testbench execution process
A normal testbench execution flow would be as follows: First, AXI configurator module configures the IP Core according to the test case. Right after that, test frames are generated from each Frame Generator and sent to the ingress ports that are enabled. Frames are generated by repeating the content defined in some specific test files in a loop. Last, frames are received (or not, depending on the test case) by the Frame Checker. This block will check the statistics corresponding to each port and will determine whether the output is the expected one according to the executed test case.
One of the highlights of SoC-e’s testbench architecture is the fact that Frame Checker can detect multiple kind of errors automatically, such as integrity errors, forwarding errors or frame losses. This is possible because Frame Generator can generate traffic with specific format (like special patterns in the payload, sequence numbers, etc…), which can be interpreted by the frame checker.
Testbench test plan
The amazing flexibility of tis testbench suite is also combined with rigorous Test Plans defined by SoC-e. For each IP Core, there is a test plan that aims to test as many features as possible in simulation environment.
As an example, Managed Ethernet Switch IP Core’s test plan is divided in five big sections:
- General Switching
- Custom Forwarding
- Filtering database
- Priority queue
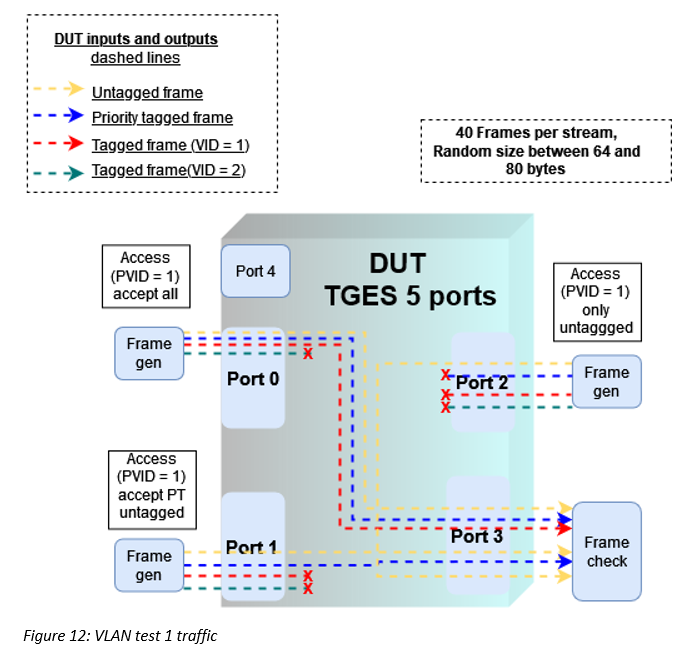
- VLAN
These sections aim to cover the behaviour of different features related to networking, as well as different traffic patterns and situations.

Simulation waveform and TCL Console
The results of the testbench can be analyzed by the developer or user in different ways. TCL Console is used for quick feedback about the test results. However, in some cases it may be interesting to deepen into specific signal values at a specific instant of the simulation.
For such cases, pre-formatted waveforms have also been developed so that it is easy to look for specific signals.
Command Line Interface (CLI) for test execution
One of the latest features included in this testbench environment, is the possibility to execute all the tests directly from a Command Line Interface (CLI), instead of requiring the need to open the RTL simulation tool (Vivado or others).
This has been a great improvement, as it enables greater automation of the tests. It is based on the use of scripting (Python) that uses Vivado compiler commands in order to generate results that are easily interpretable by the user.
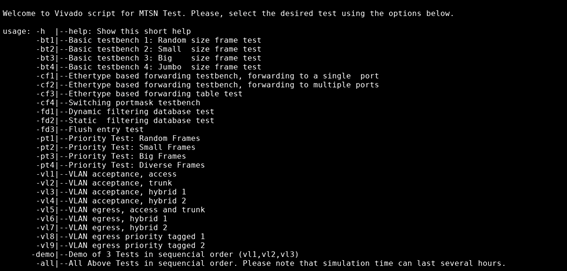
The following image shows the simulation menu displayed to the user. The user can execute any of the listed tests by simply selecting the corresponding option:

It is well known that simulation is a process which can require large amounts of time. Even if it is executed in a powerful computer, complex simulations in the range of milliseconds or above can last for dozens of minutes, if not higher.
In order to simplify the process of executing all the tests (which takes hours), we have implemented an “-all” option, which allows executing all the tests in a pipeline, without the user interaction!
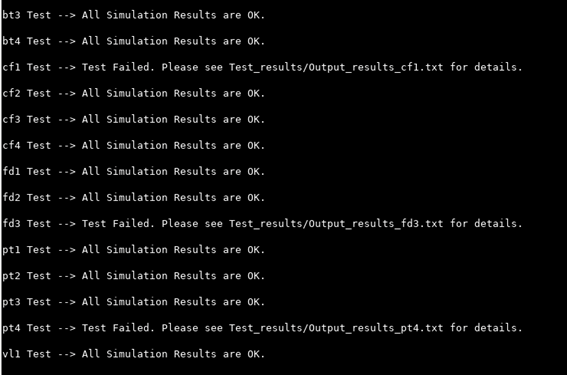
Once all the tests are completed, it will provide a report message about each test (as in the picture below), as well as generate output files in case of a test failure which can be later analyzed by the developer.

Networking Testbench Suite, now available as a product!
While all this testbench environment has only been used for internal debugging and development purposes, we have listened to our customers, which have also requested the possibility to have advanced testbenches available for themselves.
Well, we are glad to announce that it is now available for our customers! The NTS (Networking Testbench Suite) will be the perfect complement for those customers that are using any of our Networking IP Cores and would like to perform advanced simulation work (system-level simulation, etc…).
If you are interested in the product and/or want more information, please contact us at info@soc-e.com
